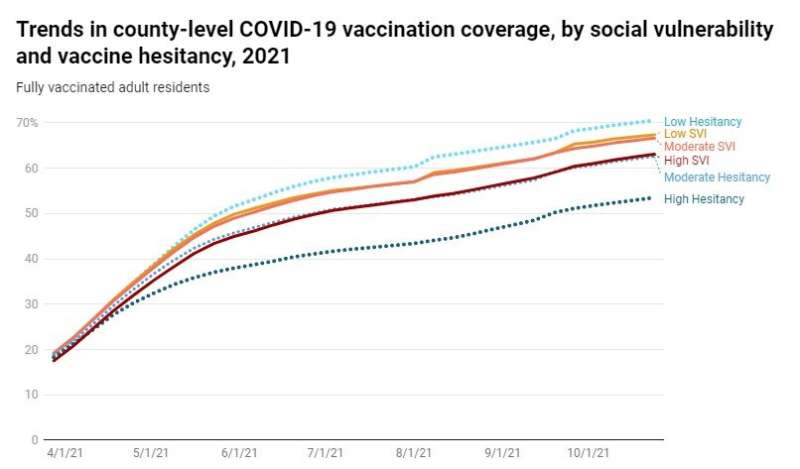
Despite widespread access, there are still wide discrepancies in COVID-19 vaccine coverage in communities across the U.S. Researchers with the USC Schaeffer Center for Health Policy & Economics and Johns Hopkins University assessed the relationship between county COVID-19 vaccination rates and both social vulnerability and vaccine hesitancy.
Published in the November issue of Health Affairs, they find almost 20% of counties are associated with high levels of both hesitancy and social vulnerability and continue to be most at risk of failing to achieve high vaccination coverage. Furthermore, their analysis shows vaccine hesitancy and social vulnerability have independently impacted vaccine rates.
The researchers are updating their findings weekly at this site, providing a tool for policymakers and public health experts to further understand county-level coverage.
“There are many factors influencing why individuals in communities across this country are not getting vaccinated including general distrust, lack of resources and access,” said John Romley, senior author on the study. “Understanding the nuances of these trends and how these two factors interact is important for decision-makers as they consider strategies for rolling out boosters or additional vaccines in the future.”
Understanding the impact and link between hesitancy and social vulnerability
Romley and his colleagues analyzed data from the CDC on 3,000 U.S. counties covering a total of 229 million residents ages 18 and older. They leveraged Department of Health and Human Services survey results to estimate hesitancy and the CDC’s Social Vulnerability Index, or SVI, to quantify county-level vulnerability based on factors like racial composition, poverty, disability, and housing limitations.
The researchers find hesitancy seems to become a stronger predictor of the differences between counties over time. By early August, counties with high hesitancy had an average vaccination rate that was 17% lower than counties with low hesitancy, even after adjusting for social vulnerability.
Meanwhile, disparities between counties with moderate to low social vulnerability and high social vulnerability were relatively smaller but have widened substantially. The coverage difference between low- and high-SVI counties increased from 1.8% in March 2021 to 4.6 percent in August 2021.
This is particularly concerning from an equity perspective, write the authors.
“The SVI was developed to help CDC and other agencies identify communities who were vulnerable to hardship from outside events,” said Ruth Faden, founder of the Johns Hopkins Berman Institute of Bioethics. “Our findings underscore the importance of prioritizing efforts to make sure these communities have the resources they need to get vaccinated.”
By the end of the study period, counties that were high on the social vulnerability index and also had high hesitancy had a significantly lower percentage of adults fully vaccinated against COVID-19 compared with counties that had high SVI or high hesitancy alone.
Source: Read Full Article
